
Here in this tutorial, you will learn how to create a chart for your website using chart.js. this is a very simple and easy tutorial.
If you want to create different types of charts, check chart types or samples on the chart.js website.
Complete source codes and images at the end 🠋🠋🠋
You may also like
Check the video tutorial
Recommended Videos
<!DOCTYPE html>
<html lang="en">
<head>
<meta charset="UTF-8">
<meta http-equiv="X-UA-Compatible" content="IE=edge">
<meta name="viewport" content="width=device-width, initial-scale=1.0">
<link rel="stylesheet" href="styles.css">
<title>charts</title>
</head>
<body>
<div class="container">
<div class="chart">
<canvas id="barchart" width="300" height="300"></canvas>
</div>
<div class="chart">
<canvas id="doughnut" width="300" height="300"></canvas>v
</div>
</div>
<script src="https://cdn.jsdelivr.net/npm/chart.js@3.8.0/dist/chart.min.js"></script>
<script src="chart1.js"></script>
<script src="chart2.js"></script>
</body>
</html>
CSS CODES
* {
margin: 0;
padding: 0;
box-sizing: border-box;
}
body {
background: #d4bdde;
display: flex;
align-items: center;
justify-content: center;
min-height: 100vh;
}
.container {
display: flex;
align-items: center;
justify-content: center;
gap: 200px;
}
.chart {
padding: 2rem;
border: 1px solid #f49131;
border-radius: 1rem;
background: #251c35;
box-shadow: 0 0 16px rgba(0, 0, 0, 0.8);
}
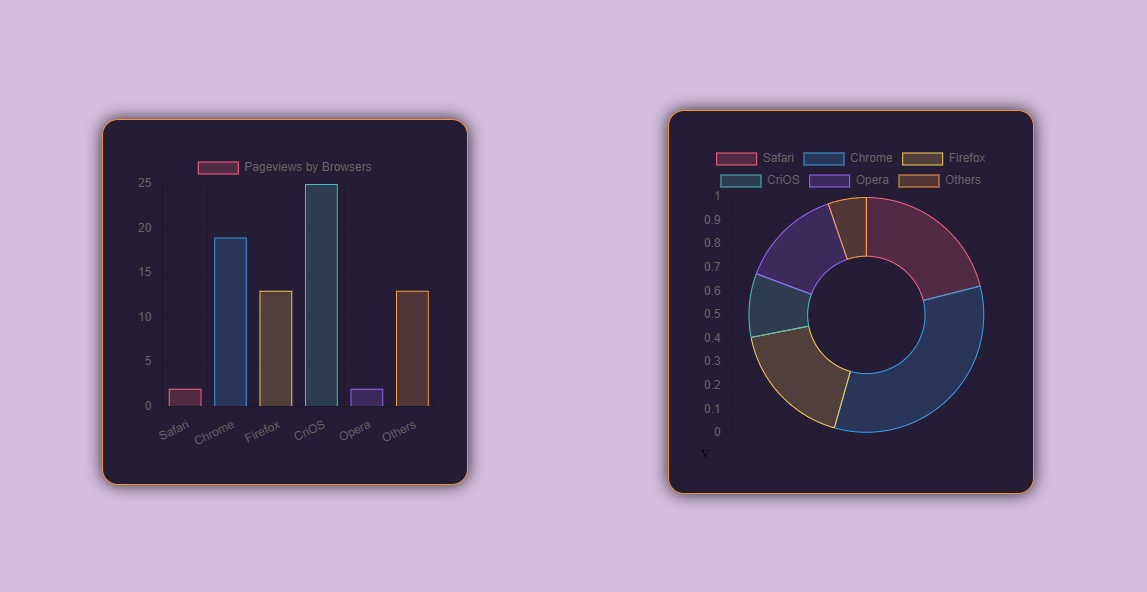
Chart 1
const ctx = document.getElementById('barchart').getContext('2d');
const barchart = new Chart(ctx, {
type: 'bar',
data: {
labels: ['Safari', 'Chrome', 'Firefox', 'CriOS', 'Opera', 'Others'],
datasets: [{
label: 'Pageviews by Browsers',
data: [2, 19, 13, 25, 2, 13],
backgroundColor: [
'rgba(255, 99, 132, 0.2)',
'rgba(54, 162, 235, 0.2)',
'rgba(255, 206, 86, 0.2)',
'rgba(75, 192, 192, 0.2)',
'rgba(153, 102, 255, 0.2)',
'rgba(255, 159, 64, 0.2)'
],
borderColor: [
'rgba(255, 99, 132, 1)',
'rgba(54, 162, 235, 1)',
'rgba(255, 206, 86, 1)',
'rgba(75, 192, 192, 1)',
'rgba(153, 102, 255, 1)',
'rgba(255, 159, 64, 1)'
],
borderWidth: 1
}]
},
options: {
scales: {
y: {
beginAtZero: true
}
}
}
});
Chart 2
const ctx2 = document.getElementById('doughnut').getContext('2d');
const doughnut = new Chart(ctx2, {
type: 'doughnut',
data: {
labels: ['Safari', 'Chrome', 'Firefox', 'CriOS', 'Opera', 'Others'],
datasets: [{
label: '# of Votes',
data: [12, 19, 10, 5, 8, 3],
backgroundColor: [
'rgba(255, 99, 132, 0.2)',
'rgba(54, 162, 235, 0.2)',
'rgba(255, 206, 86, 0.2)',
'rgba(75, 192, 192, 0.2)',
'rgba(153, 102, 255, 0.2)',
'rgba(255, 159, 64, 0.2)'
],
borderColor: [
'rgba(255, 99, 132, 1)',
'rgba(54, 162, 235, 1)',
'rgba(255, 206, 86, 1)',
'rgba(75, 192, 192, 1)',
'rgba(153, 102, 255, 1)',
'rgba(255, 159, 64, 1)'
],
borderWidth: 1
}]
},
options: {
scales: {
y: {
beginAtZero: true
}
}
}
});
Don't forget to Subscribe to our Youtube Channel for more.
0 Comments